Are you looking to create an engaging and visually appealing way to communicate complex information? Interactive Infographics have become a popular choice for achieving just that. In today’s world, people are constantly bombarded with information from various sources. As a result, it can be challenging to capture and retain their attention. Interactive Infographics have emerged as a powerful tool to communicate complex information in a visually engaging and interactive way. Interactive Infographics are not only eye-catching but also allow users to interact with the data, making the experience more immersive and memorable.
Research shows that 88% of marketers say Interactive Content helps brands differentiate themselves from competitors. Are you one of those marketers who believes in Interactive Content and plan to include it in your strategy?
In this blog post, we’ll show you how to create visually stunning and engaging infographics that will captivate your audience. Discover the power of interactivity and learn how to create Interactive Infographics that leave a lasting impression on your customers.
By incorporating interactivity into your content, you can reap the top 3 benefits of Interactive Content. Firstly, the nature of the content itself leads to higher engagement rates. Secondly, Interactive Content allows you to capture more data from your audience. And lastly, combining these two benefits can help to improve brand loyalty by offering your viewers and customers an extraordinary experience that involves them in the story.
Jump to your preferred section:
- What is an Interactive Infographic?
- 6 Important factors for creating Interactive Infographics
- 3 Ways of making an Interactive Infographic
- Creating an Interactive Infographic using a customizable template
- Creating a simple Interactive Infographic
- Creating an advanced Interactive Infographics
What is an Interactive Infographic?
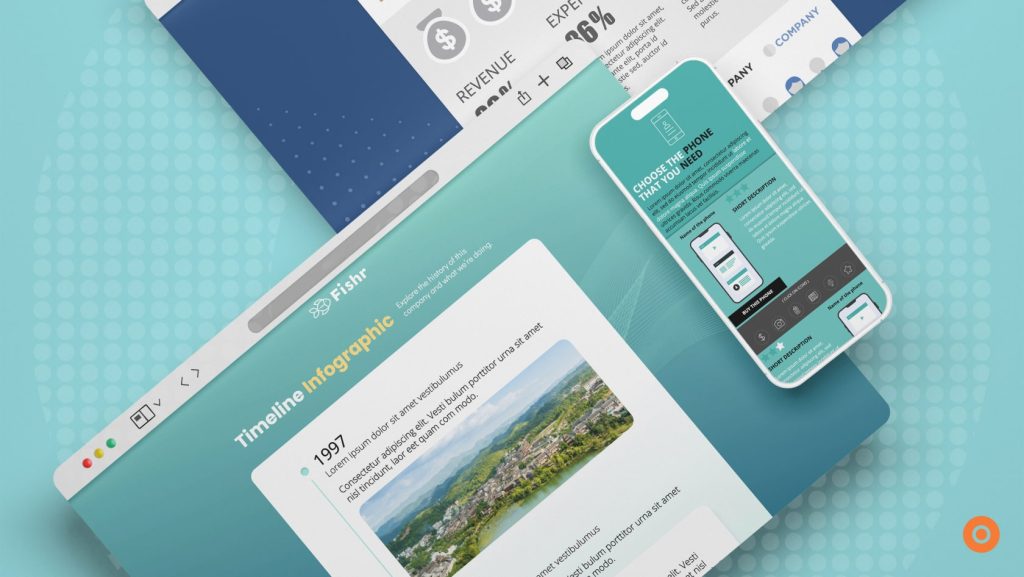
An Interactive Infographic is a visual representation of data or information that allows the user to interact with the content. Unlike traditional infographics, Interactive Infographics offer a more engaging experience, allowing the user to explore the information in a more dynamic and personalized way. By incorporating various interactive elements, such as clickable buttons, animations, or quizzes, Interactive Infographics can enhance the user’s understanding and engagement with the content.
Related: What is an Interactive Infographic
6 Important Factors for Creating Interactive Infographics
Before you dive right into creating an Interactive Infographic, consider these 6 important factors:
1. Target the right audience
The first and most important step in creating an Interactive Infographic is understanding your target audience. You need to figure out who they are, what their needs and preferences are, and how they behave. This information will help you create an infographic that is specifically tailored to their interests and preferences.
2. Consistency is key
Your Interactive Infographic should have a logical and consistent flow that takes your customers through an understandable journey. This means organizing your information in a way that makes sense, following a step-by-step process, and using a narrative framework.
3. Tell a story – visually
Visual storytelling is a powerful tool for engaging people and making it easier for them to remember information. It involves using a graphic that catches the attention, along with relevant and valuable content to your customers.
4. Choose the right layout and design
Once you have a clear idea of the story you want to tell and the data you want to use, it’s time to get creative. Choose a layout, design, and color scheme that makes the most sense for your infographic. There are 8 types of Interactive Infographics to choose from, depending on your needs and objectives.
5. Bring data to life
Interactive Infographics are a great way to showcase data and bring it to life for your audience. Use animated visuals like pie charts, line graphs, and bar graphs to make your data more engaging and easier to understand. You can also use interactive elements like Marketing Games and quizzes to make the experience more fun.
6. Promote your efforts
Finally, don’t forget to promote your Interactive Infographic! Share it on your website, blog, social media, and emails. Make sure it’s shareable on all platforms, and consider publishing it on SlideShare for maximum reach. A consistent promotion strategy is key to educating and informing as many people as possible with your infographic.

3 ways of making an Interactive Infographic
Whether you are looking to create an Interactive Infographic in the most simplistic or a more complex way, this blog post aims to serve you with a generic guide. What you’ll find here is a generalized guide to the most essential stages in the creation process to provide you with an understanding of the different solutions you can choose. Let’s get those ideas flowing and dive into the world of Interactive Infographics!
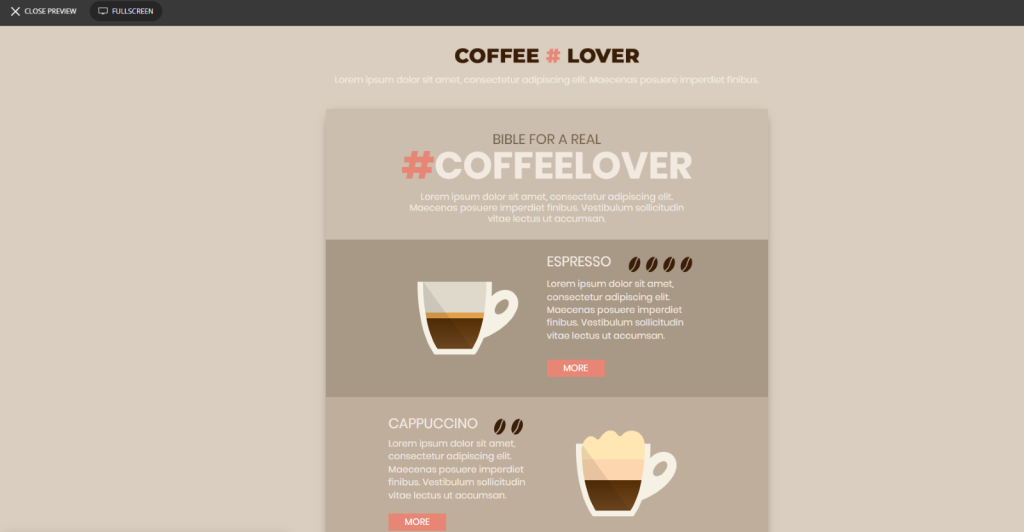
Use a customizable template
Let’s kick things off with a super easy way to create engaging content. Using a customizable template allows users to easily modify the design and text of the infographic without the need for any advanced graphic design skills or software.
Users can customize the infographic by simply replacing the placeholder text with your own text, adding or removing sections, changing colors, fonts, and images to suit their specific requirements.
1. Choose a customizable template
Dot.vu offers a variety of pre-designed customizable templates that you can choose from. Browse the templates and select the one that best suits your needs.

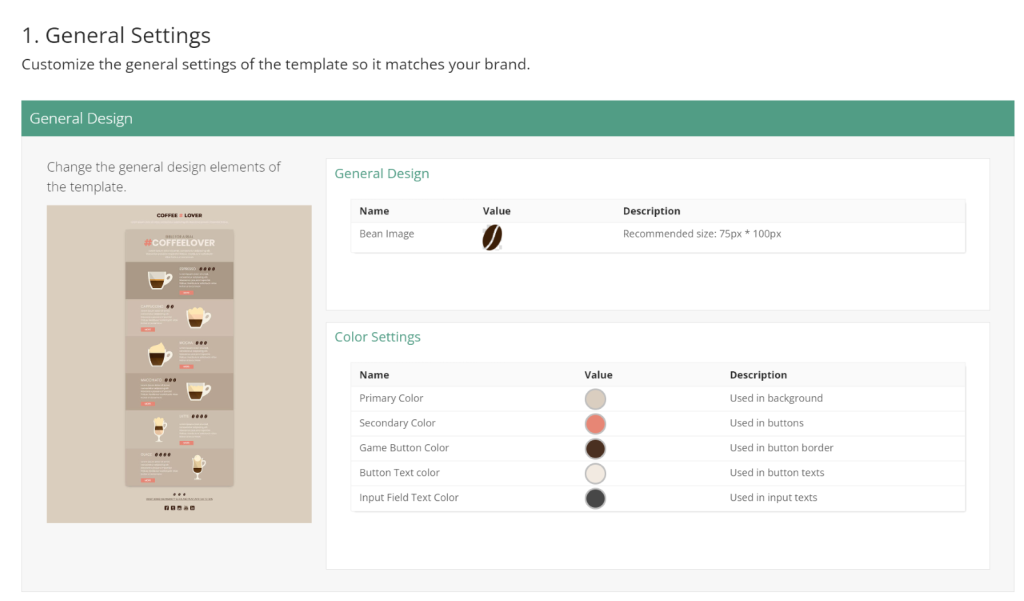
2. Customize the template
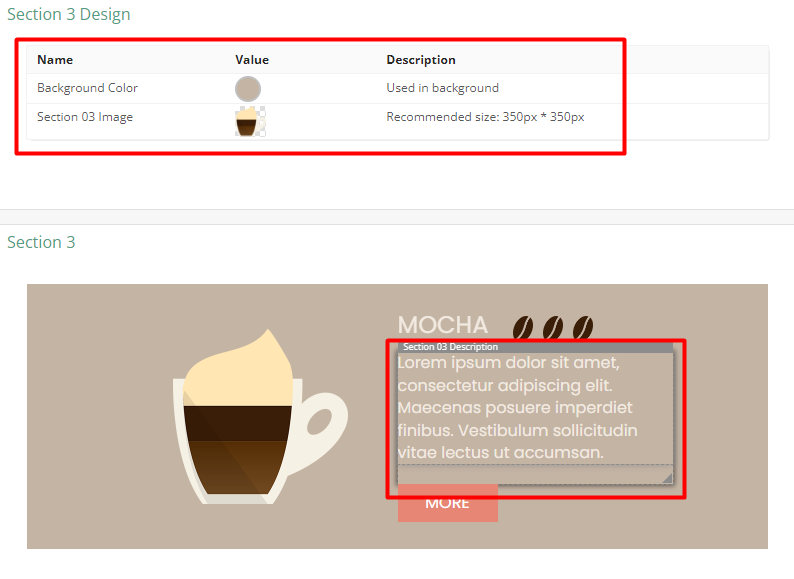
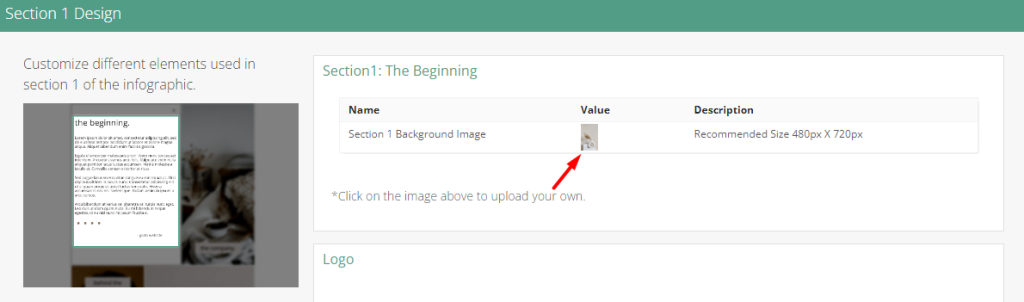
Once you’ve selected a template, start customizing it by replacing the placeholder text with your own text, adding or removing sections, changing colors, fonts, and images to match your brand’s identity.
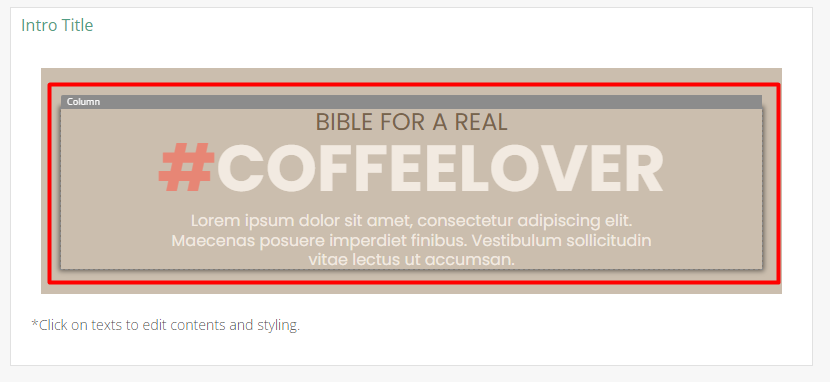
3. Customize the title
Edit the header section of the infographic to include your tagline, or any other information you want to display at the top of your infographic.
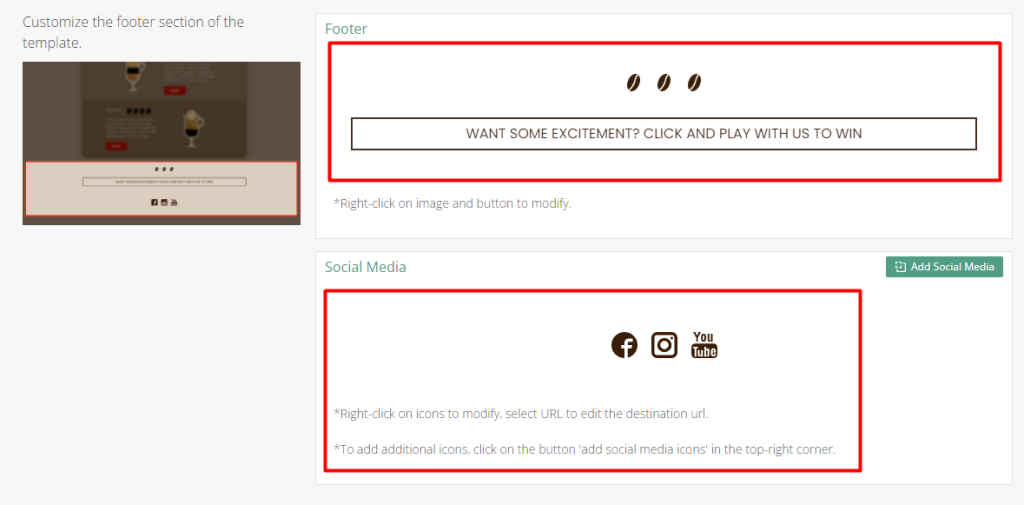
4. Customize the footer
Edit the footer section of the infographic to include your contact information, website URL, or any other details you want to display at the bottom of your infographic.
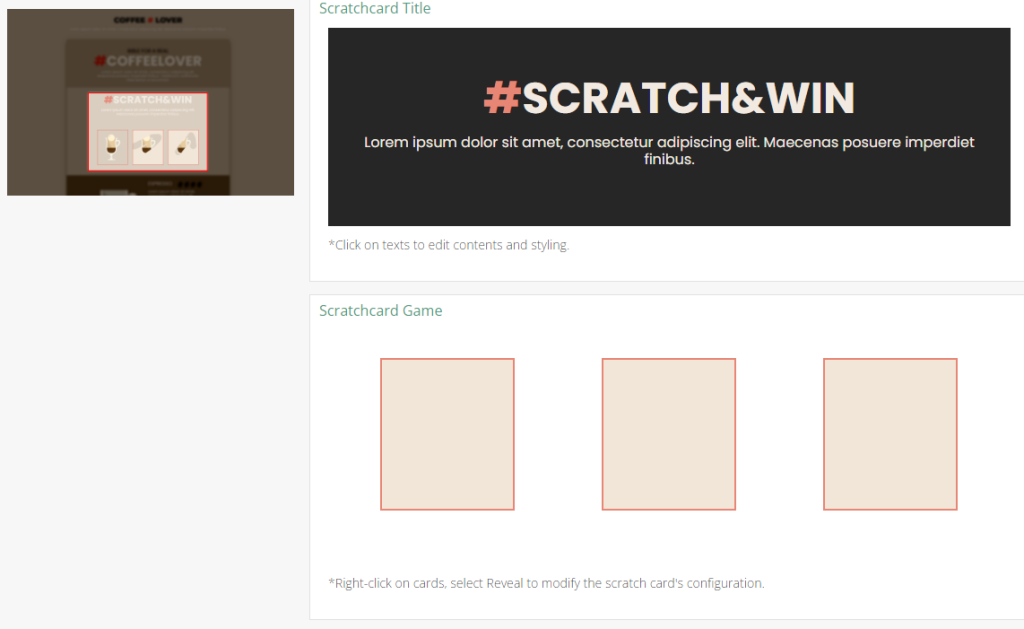
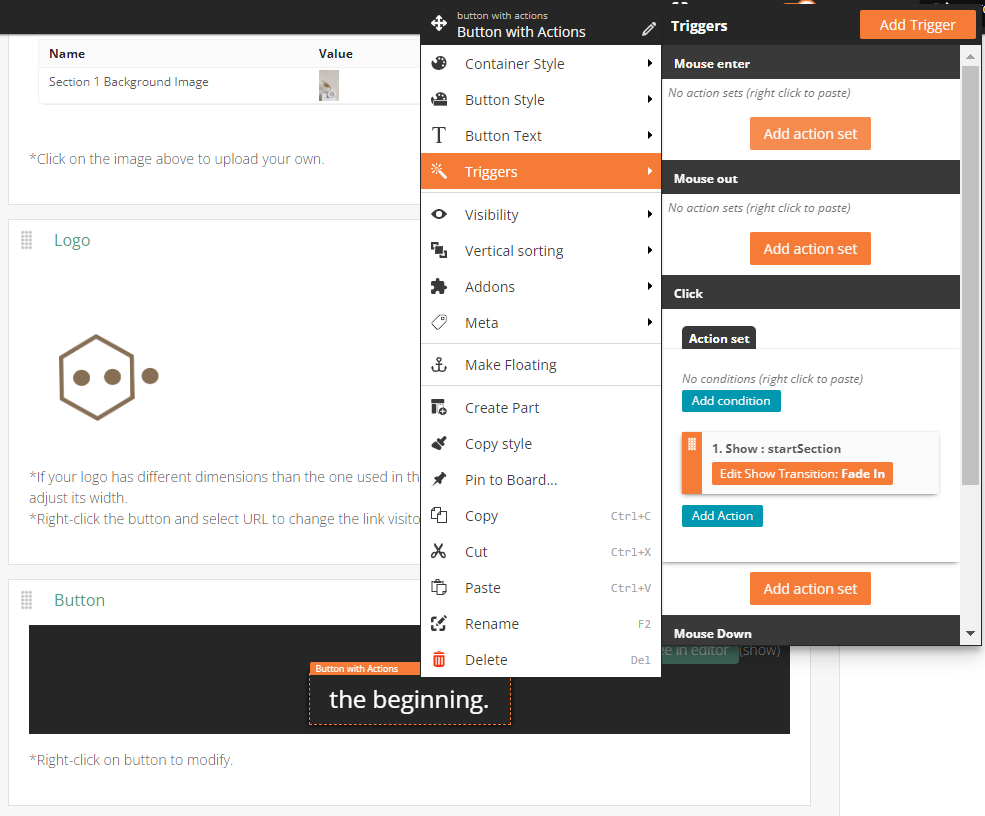
5. Add interactive elements
You’re almost done! Dot.vu’s platform allows you to add interactive elements to your infographic, such as clickable buttons, animations, games, and many more. Add some interactive elements to your infographic and make it more engaging and interactive.
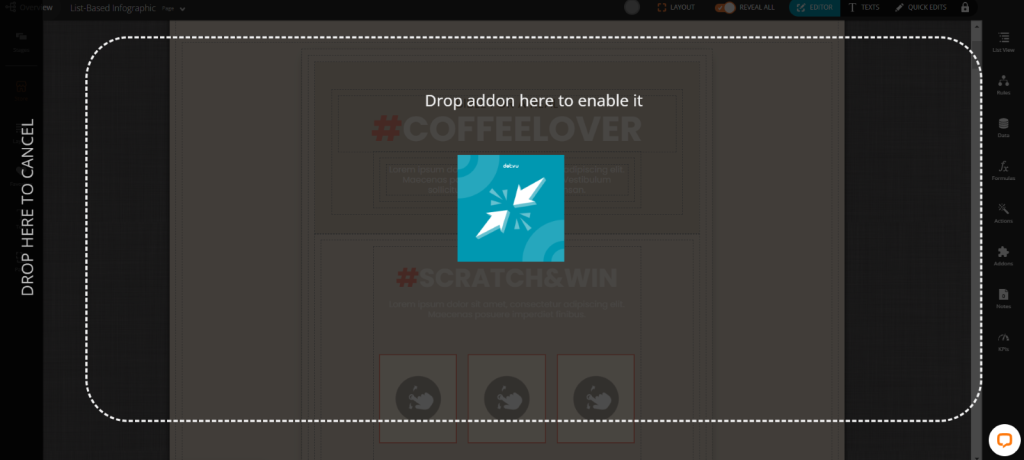
6. Use the drag-and-drop feature
Dot.vu’s drag-and-drop feature in the editor will enable you to add your own text, images, and interactive elements to the template. With the drag-and-drop editor, you can quickly rearrange and customize elements within the template to fit your content and design preferences.
7. Preview and test
Before publishing your infographic, preview it and test its interactivity to ensure that everything is working correctly. This step is essential to make sure that your viewers have a seamless and enjoyable experience when interacting with your infographic.
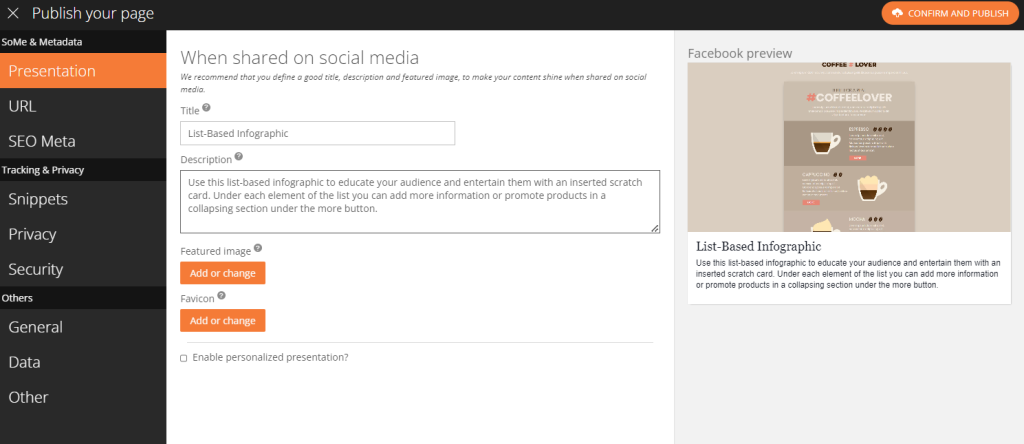
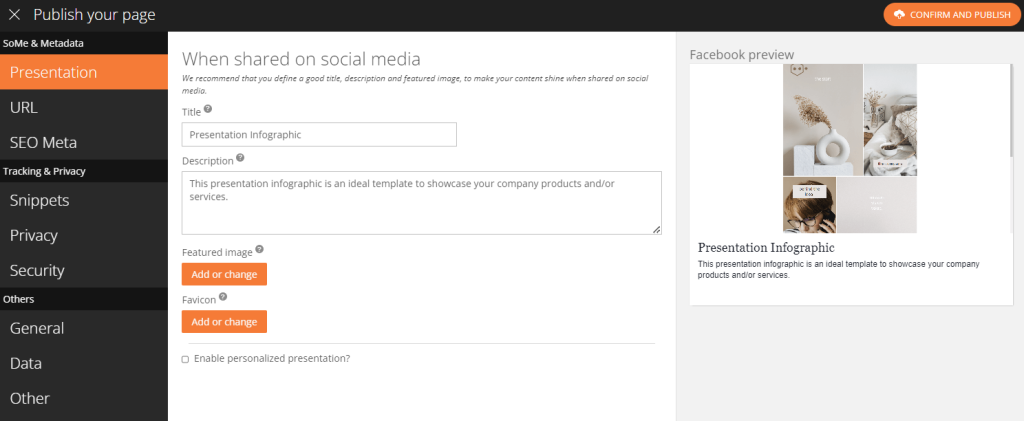
8. Publish and share
Once you’re satisfied with your interactive infographic, publish it, and share it with your target audience. And that’s it! Easy right? You can also embed it on your website or share it on social media platforms to get more views and engagement.
Pro tip: You can learn by doing! Create a free account on Dot.vu and follow the steps in this blog article. You will have your own Interactive Infographic before you know it!
How to make a simple Interactive Infographic?
Take your existing static infographics and inject some interactivity into them! Adding interactivity is a fantastic way to provide a more immersive experience for your audience, making your content more memorable and persuasive. After all, visuals and interactive elements tend to stick in our long-term memory much better than plain text and numerical data. When we’re presented with text or a phrase, it tends to only stick around in our short-term memory.
So, why not take advantage of the power of interactivity to create a more engaging experience for your audience?
1. Modify existing infographic image & upload image(s)
If you’re looking to create an Interactive Infographic, you’ve got options! It all depends on what you want to achieve. To get started, think about which elements you want to animate and make sure your text is uploaded separately so you can add it as another layer to your infographic. This way, you can make changes to the text anytime without starting from scratch. No more stressing over recreating the entire infographic – talk about a win-win!

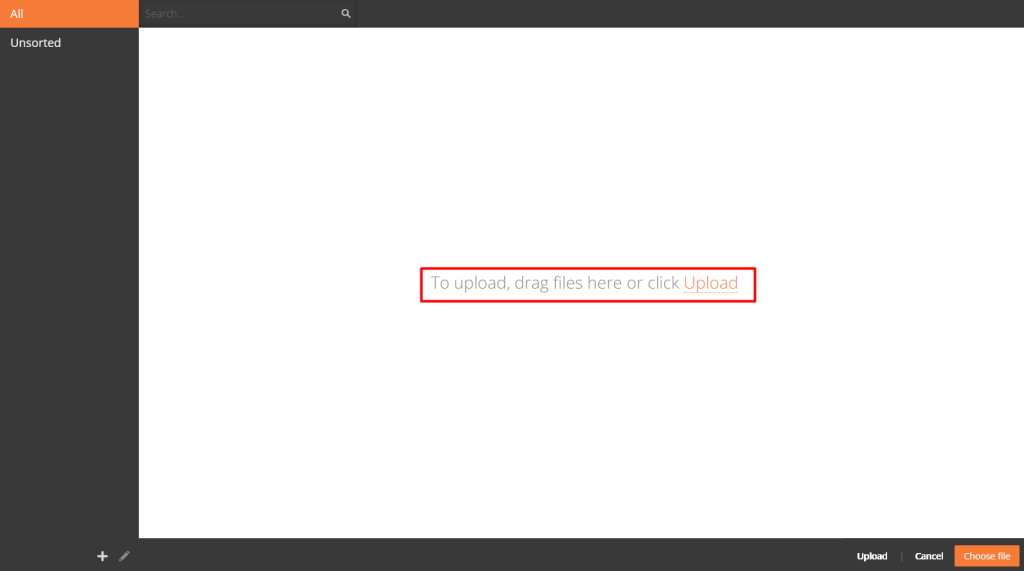
Once you are done deciding on these elements, you can go ahead and upload an image file of your static infographic.
2. Add interactivity
Now it’s time to get creative! Take some time to think about the interactive elements you want to add to your infographics. The sky’s the limit when it comes to creating engaging content, so don’t be afraid to think outside the box. You can add clickable hotspots that lead to URLs, videos, lead forms, and animations to really amp up the user experience. The goal is to leave your readers feeling amazed and engaged – so go ahead and let your creativity run wild!
3. Publish & share
Congratulations, you’re almost there! The final step is to publish and share your masterpiece across your website and social media profiles. Once it’s out there in the world, give it some time to perform and then come back to see how it’s doing. If it’s not quite hitting the mark, don’t worry – you can always make changes to improve its performance and better meet your expectations. To measure its success, make sure to set up key performance indicators (KPIs) to track its progress over time. With a bit of tweaking and some patience, your Interactive Infographic is sure to be a hit!
How to make an advanced Interactive Infographic?
If you are looking to create a more dynamic experience with more added interactivity, look no further than Dot.vu’s advanced solution. It’ll take a bit more planning and effort, but trust us, it’s worth it.
Let’s see the steps you need to take into consideration when creating an advanced Interactive Infographic.
1. Define the infographic/UX
With the advanced method, you’ll start from scratch and create a wireframe that outlines the user experience you want to provide for your audience. This step is crucial in visualizing the Interactive Experience you’re planning and making sure it’s engaging and highly interactive. We offer a wide range of Interactive Experiences to choose from, including Quizzes, Assessments, Marketing Games, Interactive Videos, Popups, Polls, Contests, Product Recommenders, and many more. Depending on your needs and the type of infographic you’re creating, you can mix and match these elements to create a truly unique experience.
Related: 12 Amazing types of Interactive Content
2. Create content
Now it’s time to focus on creating all the content you’ll need for your Interactive Infographic. Your content should be interactive and visually appealing, conveying your message effectively. Stick to your wireframe and create any necessary content, such as questions and answers for a quiz or product recommendations. Every part of your infographic that includes text should be written at this stage. With the right content, your Interactive Infographic is sure to capture your audience’s attention!
Consider looking at Dot.vu’s client project, like the Consumer Debt Infographic. This success story showcases how a debt consolidation company was able to improve their online presence and increase user engagement with an Interactive Infographic. By incorporating engaging visuals and easy-to-understand content, they were able to provide value to their audience and achieve their goals. Learn from their example and use your own creativity to make your Interactive Infographic stand out.

3. Create a mockup
Now that your wireframe and content are complete, it’s time to create a mockup. This step helps you visualize how your Interactive Infographic will look and function. It’s important to plan and consider how it will appear on both desktop and mobile versions. This ensures that your Interactive Experience is successful and user-friendly. If necessary, you can make changes to improve the user experience at this stage. So, take the time to create a mockup that you are happy with before moving on to the next step.
4. Upload images & create infographic
Once you’ve nailed down the wireframe and content, it’s time to bring your ideas to life with a mockup! Go ahead and upload your images and create the Interactive Infographic. This process can be either simple or quite complex, depending on the user experience you have planned as the first step. What you need to do here is simply create the layout, add the content you defined earlier, and finally, the logic. The layout and content are the ones that will be upfront, directly interacting with your users. Then, the logic will operate in the background, ensuring that the infographic has a smooth, easy-to-understand flow.
5. Publish & share
Created an amazing Interactive Infographic? Great! Now, publish it on your website and share it on social media to reach more people. But remember, creating an Interactive Infographic is just the beginning. By monitoring the KPIs, you can gain valuable insights into how your audience interacts with your content, allowing you to optimize and improve the experience over time. The possibilities are endless when it comes to creating engaging Interactive Content, so don’t be afraid to experiment and push boundaries. Besides, if any of your goals are not being achieved, you can always optimize the experience you have created. This way, it is assured that you will have the possibility of always making changes and better engagement with the consumers of your infographic.
Are you ready to create your own Interactive Infographic?
As you can see, creating an Interactive Infographic can be an exciting and rewarding experience that can help you engage with your audience in a fun and innovative way. By following the steps outlined above, you can create a visually appealing and Interactive Infographic that will capture your audience’s attention and keep them engaged.
But why stop there? With our customizable templates and easy-to-use platform, you can take your Interactive Content to the next level. So, what are you waiting for? Sign up for a free account and try out our templates today. See for yourself how Interactive Infographics can transform your content and take your engagement to new heights!