Most marketers recognize the advantages of utilizing infographics to enhance brand awareness and engage with their users. As a matter of fact, 65% of brands have implemented infographics into their content marketing strategies. However, many are not familiar with the concept of Interactive Infographics. Incorporating interactive elements into infographics can significantly improve audience engagement and generate better results than traditional infographics. Therefore, marketers can greatly benefit from learning about the specifics of this Interactive Experience.
Before delving into Interactive Infographics, it’s important to define what an infographic is. While Oxford Dictionary provides a broad definition of infographics as “information or data that is shown in a chart, diagram, etc. so that it is easy to understand,” the main goal of an infographic is to present information in a way that is visually appealing and easy to understand.
Interactive Infographics adhere to these same principles, but with extra interactive elements that can enhance user engagement. This article will explore what Interactive Infographics are, why they are essential, and provide examples of interactive elements that can be added to six different types of infographics.
Table of contents:
What is an Interactive Infographic?
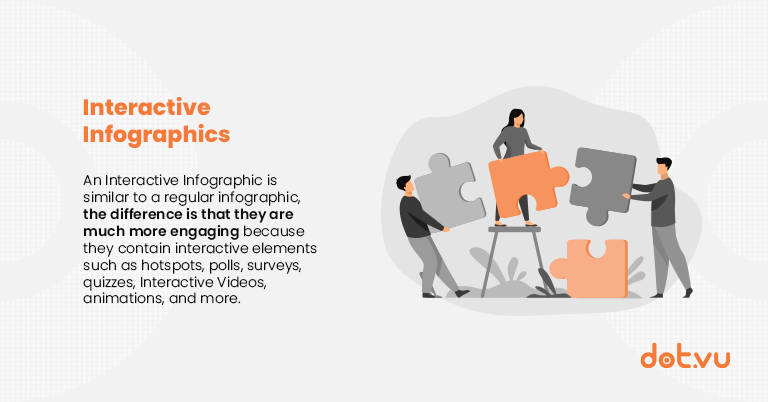
| An Interactive Infographic is type of Interactive Content that incorporates elements like hotspots, polls, quizzes, and animations, enabling active audience engagement beyond traditional infographics. It’s adaptable in format and design, ensuring mobile responsiveness and visual appeal. |
An Interactive Infographic incorporates interactive elements such as hotspots, polls, surveys, quizzes, Interactive Videos, animations, and more, setting it apart from regular infographics. These elements make the viewing experience much more engaging, allowing the audience to interact with the data. Therefore, with the many types of Interactive Content, viewers can actively engage with it through the interactive elements instead of passively reading the infographic.
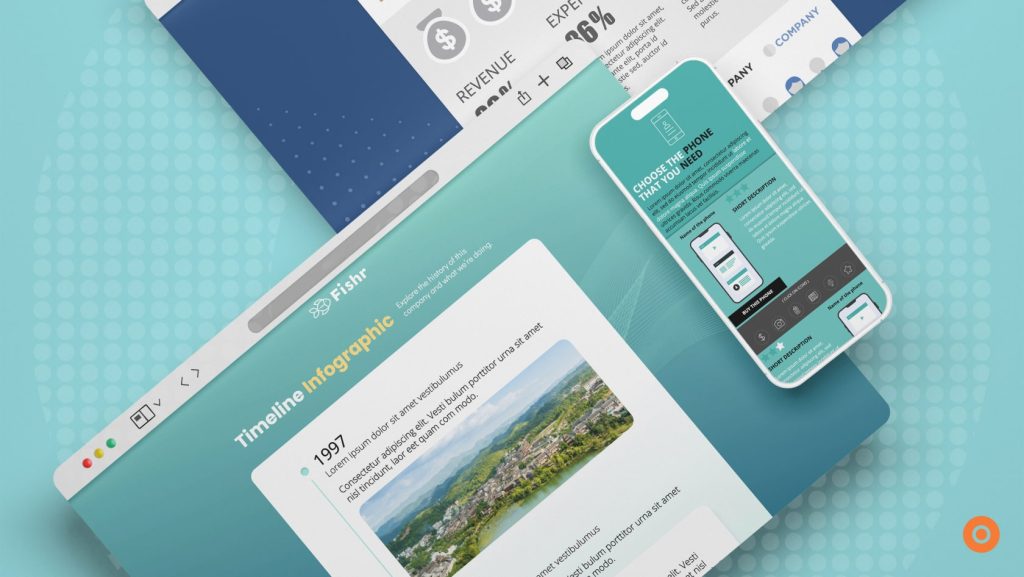
One notable difference between a regular infographic and an interactive one is mobile responsiveness. While many marketers believe that an infographic must be a certain size, such as the common 800 x 2000 pixel format used by tools like Canva, the truth is that infographics can take any format or shape, as long as the content is presented in a visually appealing and accessible way.
Interactive Infographics provide a unique opportunity to present information in an engaging and visually appealing manner, capturing the audience’s attention in a more effective way. By incorporating interactive elements, the viewer becomes an active participant in the experience, leading to a higher level of engagement and, ultimately, better results for the marketer.
An excellent example of a successful Interactive Infographic is the Consumer Debt Infographic created by Dot.vu. Dot.vu used hotspots and interactive elements to create an engaging experience that allowed viewers to learn about the dangers of consumer debt in a fun and interactive way. This success story demonstrates the power of Interactive Infographics in educating and engaging audiences while achieving marketing goals. With the right design and interactive features, Interactive Infographics can help businesses effectively communicate complex information and engage their audience in a unique way.
Why is it important to create an Interactive Infographic instead of a traditional infographic?
There are 5 main goals of designing a traditional infographic, and adding interactive elements can help to achieve each of these goals more effectively:
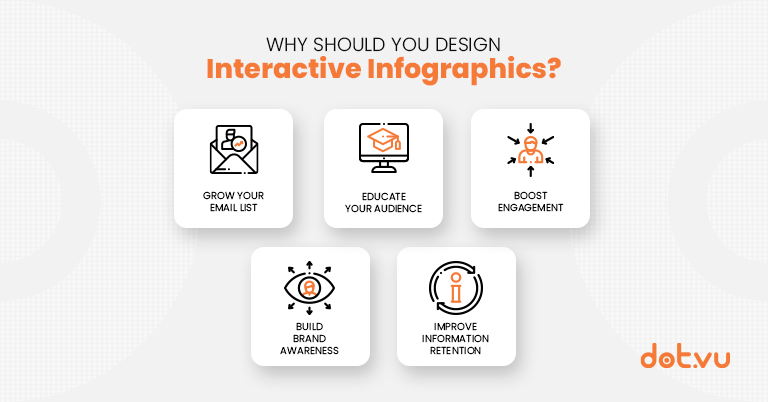
1. Build brand awareness
Infographics are a powerful tool for building brand awareness, but Interactive Infographics take it to the next level! Think of it as the second-generation of infographics, like evolving your marketing strategy with a rare and impressive Pokemon. Since Interactive Infographics are less common, they have a higher chance of being shared and reused by other companies or users, giving you a wider audience and increased brand awareness.
Hence, you’ll expand your reach while leveling up your marketing game, and you’ll increase brand awareness even more than with a regular infographic.
2. Educate your audience
Infographics are an excellent way to educate your audience quickly and efficiently. However, creating an infographic with too much content can lead to overcrowding and loss of clarity. But fear not; with an Interactive Infographic, you can avoid this issue. Hotspots and mouseovers allow you to add more details without cluttering the design. Plus, you can include Interactive Videos to explain complex points or concepts. The possibilities of adding more content without sacrificing clarity or attractiveness are endless. So, get creative and design an Interactive Infographic that will educate and engage your audience like never before.
3. Boost engagement
Unlike traditional infographics, Interactive Infographics provide an immersive experience that allows your audience to actively participate. From quizzes to polls, hotspots to Marketing Games, the possibilities are endless! By giving your audience the opportunity to engage and interact, you create a more memorable and impactful experience that increases brand recognition and loyalty. In other words, Interactive Infographics are not only informative but also fun and interactive, making them an excellent tool for any marketer looking to create engaging content.
4. Grow your email list
Interactive Infographics can be a game-changer for growing your email list. While a conventional infographic can only gate the entire content with a lead form, an Interactive Infographic allows you to gate specific sections or interactive elements. By providing value upfront, customers are more likely to give their personal information.
You can also attach a report to your infographic or add a branded marketing game with a contest to attract more leads. Adding a marketing game, like a Spin & Win game with a contest, to your Interactive Infographic is another fantastic way to grow your email list. With these strategies, you can make your Interactive Infographic a valuable lead generation tool.
5. Improve information retention
By incorporating interactive elements into an infographic, viewers are more likely to remember the information presented, leading to better retention and a more significant impact on the audience. Interactive elements, such as quizzes or games, can make the learning experience more enjoyable, reinforcing the information in a fun and engaging way. Interactive elements also allow viewers to explore the information presented at their own pace and in a manner that resonates with them, improving their understanding and retention of the material.
Overall, Interactive Infographics create a more engaging and effective learning experience that can improve retention and ultimately lead to better outcomes for marketers communicating important information to their target audience.
8 Types of Interactive Infographics
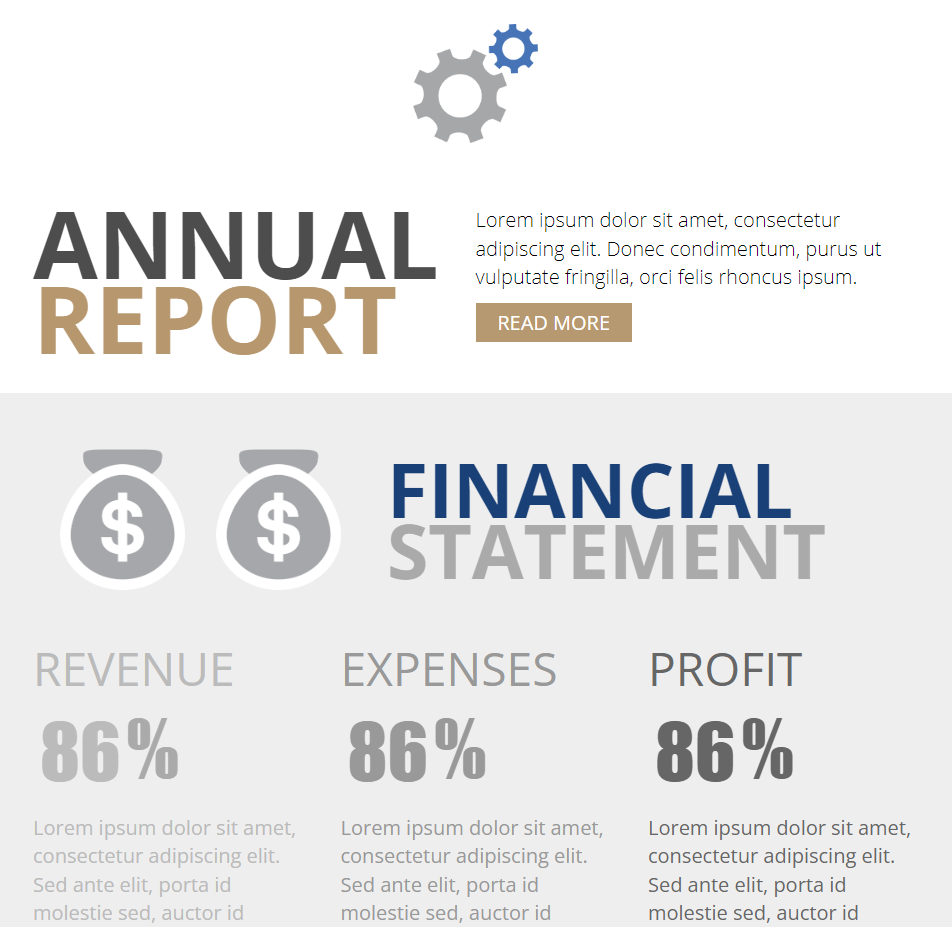
1. Statistical Infographic
Infographics are a great way to spice things up and present data in an exciting and visually appealing way. With pie charts, pictograms, maps, and bar graphs, you can make your statistics come alive. And with a Statistical Interactive Infographic, you can take it to the next level with animated elements that will captivate your audience.
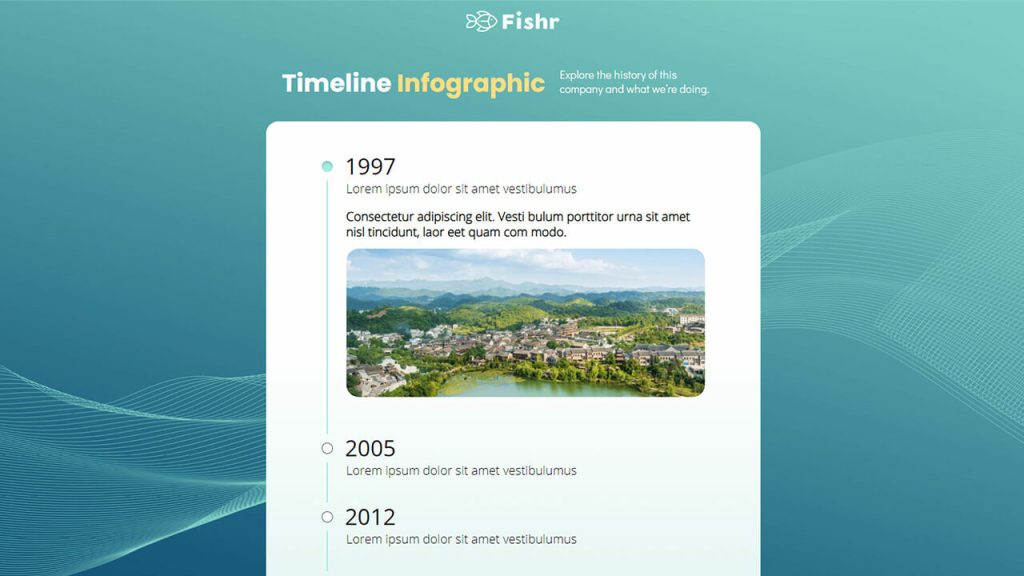
2. Timeline Infographic
Great for highlighting something that evolved over time or telling a story chronologically. Businesses can also take this opportunity to present a company’s story in a creative way. When creating an Interactive Timeline Infographic, you can add more details with hotspots or videos.
3. Process Infographic (Also called How-to Infographic)
Describes a process step-by-step. When creating an Interactive Infographic, you can expand each step with regular or Interactive Videos to help teach your audience.

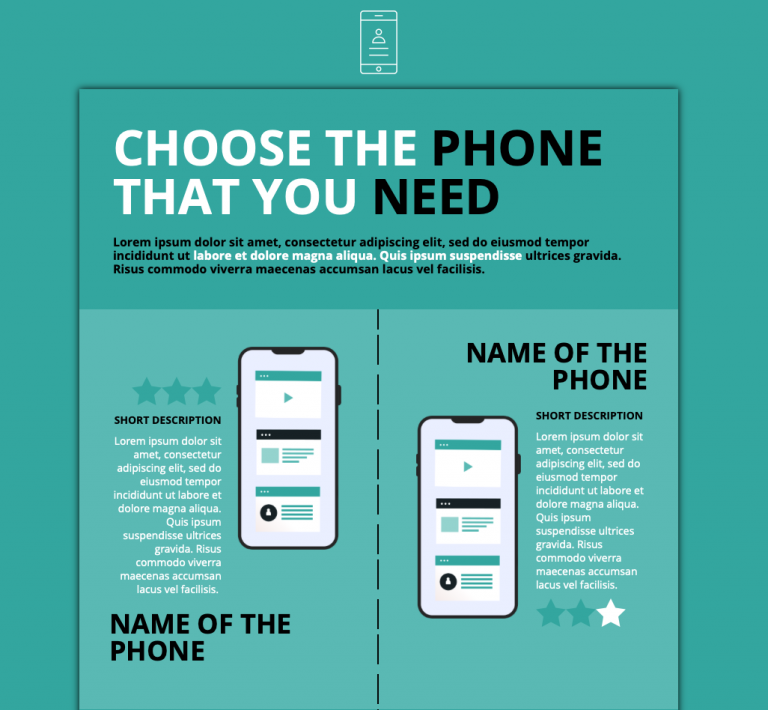
4. Comparison Infographic
A Comparison Infographic compares two similar things side-by-side to highlight their differences, helping your audience make informed decisions. Adding a “Buy Now” button in a Comparison Interactive Infographic allows viewers to add items directly to their basket, making the buying process shorter and securing sales.
5. Informational Infographic
A mix of all types of infographics. They can become overcrowded, but adding clickable hotspots can help keep them visually appealing. They are great when you want to really educate your audience on a complex concept, as it allows you to add many different elements.

6. List Infographic
Interactive List Infographics are easy to design, featuring mostly text and icons. An advantage of creating an interactive version is the ability to use an accordion to promote products or services under each point.
7. Hierarchical Infographic
Hierarchical infographics organize information into levels based on factors such as importance, difficulty, or income level. Clear display of the differences between levels is crucial, with emphasis on comparing and showing relationships between them. To make them more engaging for your audience, interactive elements can be added to these infographics.
8. Location Infographic
Location infographics communicate trends across regions, local, national or global. Easily compare changes based on regional and global statistics, relevant to readers. Add interactive elements such as maps, charts and clickable data points for a visually appealing and engaging infographic.
Related: 8 Types of Interactive Infographics
How to get started with Interactive Infographics?
Here are some key steps to follow when starting with Interactive Infographics:
- Choose a topic: Start by selecting a topic that is relevant to your audience and something that you want to communicate effectively through an infographic.
- Collect data: Gather all the necessary data and information that you want to present in your infographic.
- Identify user interactions: Determine how you want your users to interact with the infographic, such as clicking on certain elements, hovering over areas, or taking a quiz.
- Sketch your design: Create a rough sketch of your design and layout, keeping in mind the user interactions you have identified.
- Use an online tool: Utilize an online tool like Dot.vu to create your Interactive Infographic.
- Incorporate interactivity: Add Interactive elements such as animations, hover effects, videos, quizzes, or anything else that will engage your audience.
- Optimize for SEO: Optimize your Interactive Infographic for search engines by adding alt tags, meta descriptions, and relevant keywords.
- Publish and share: Publish your Interactive Infographic on your website or social media platforms and share it with your audience to increase engagement and brand awareness.
For a more comprehensive guide on creating Interactive Infographics, check out our full guide on how to make Interactive Infographics.
To wrap it up, Interactive Infographics are like a superhero in the marketing world. They have the power to captivate and educate audiences, making information fun and easy to digest. With the ability to incorporate multimedia elements and interactive features, they provide an immersive experience that encourages users to stay on your website for longer. So, if you want to boost your engagement and conversion rates, it’s time to suit up and start creating some Interactive Infographics!
Are you looking to create more engaging content for your audience?
Look no further than Interactive Infographics! At Dot.vu, we’re confident that this trend will only continue to grow in popularity in the coming years, so don’t miss out on the opportunity to be ahead of the game. And the best part? Interactive Infographics aren’t just for B2C companies – Interactive Infographics can be of great benefit for your B2B interactive marketing strategy.
Ready to get started? Sign up for a free account on Dot.vu and try out our Interactive Infographic templates. You’ll be amazed at how easy and effective they are! Plus, why not take it up a notch by adding a fun Marketing Game like Spin & Win to your Interactive Experience?
This blog post was updated by Felicia Rozario on March 3th, 2023.