With the increasing importance of Interactive Content, lots of marketers might wonder how they can measure the success of Interactive Content and what Interactive Content metrics they should keep an eye on.
Of course, when monitoring the performance of Interactive Content, you can keep the general content metrics you have always been following. Nonetheless, there are a few differences in measuring the success of Interactive Content versus static content.
In this blog post, we will start by explaining why it’s very important to measure the success of your Interactive Content strategy with the right metrics. Then, we will continue by explaining how you can set up your Interactive Content strategy to boost success. After we introduce the most important Interactive Content metrics you should follow. We will also discuss how A/B testing is an incredible feature that you can use when creating Interactive Content. Finally, we will explain how using an Interactive Content platform can help you track the right Interactive Content KPIs.
Why measure the success of Interactive Content?
How to set up an Interactive Content strategy?
Most important Interactive Content metrics
Interactive Content and A/B Testing
Why should you use an Interactive Content platform
Why is it important to measure the success of Interactive Content
Compared to static content, Interactive Content is never set in stone. You can always modify your Interactive Experiences along the way. That’s one of the reasons why tracking the right Interactive Content metrics in real-time is so important.
For example, if you realize that you get lots of traffic to your gated Interactive Flipbook, but that only 10% of visitors fill in the form to get access to the flipbook, you might want to remove the gating form. Or, you can also think about Gated Content Best Practices and reposition your form somewhere else within the Interactive Flipbook.
In other words, with Interactive Content, you can always modify your Interactive Experiences on the spot to optimize them. That’s why it’s extremely important to always keep an eye on the right Interactive Content KPIs.
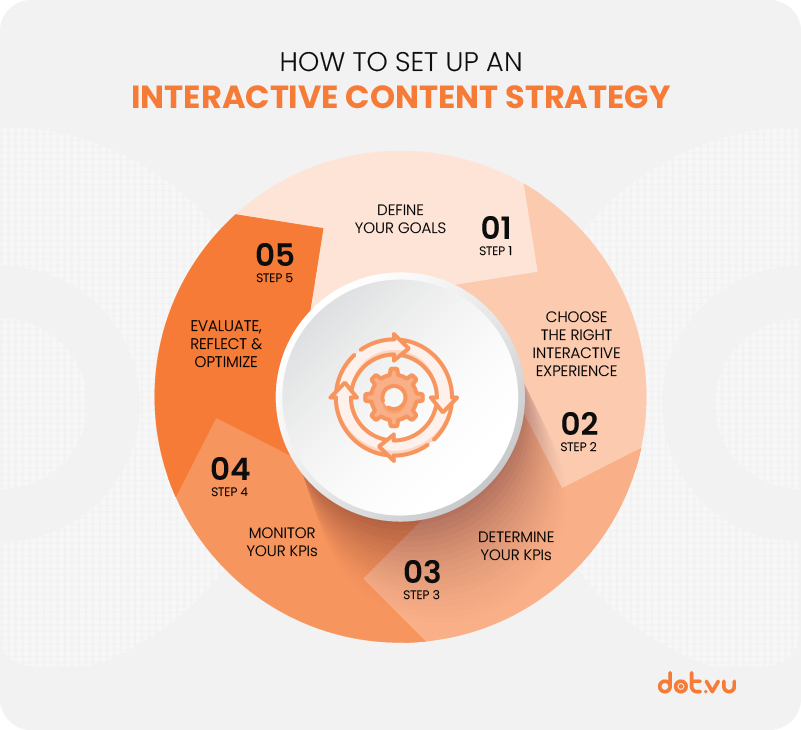
How to set up an Interactive Content strategy
In the following steps, you’ll learn how to set up your Interactive Content strategy in the right way to measure its success.
1. Define your goals
Start by defining SMART goals. SMART is an acronym that stands for specific, measurable, achievable, relevant and Time-Bound. When choosing Interactive Content goals, you can think about your buyer’s journey content and reflect on which stage you should improve. For example, if you have a hard time getting new leads, you can have the following goal:
Gain 400 new leads in the 2nd quarter of 2022.
We recommend only having a very minimum number of Interactive Content goals (3 to 5), so that you are focused on what really matters and you don’t get distracted along the way.
2. Choose the right Interactive Experiences
Now that you have a shortlist of Interactive Content goals, you can decide what Interactive Experiences you want to create to achieve these goals. Remember that there are many different types of Interactive Content and some are better for specific goals than others.
If we keep our previous example of gaining new leads, you might be interested in the following Interactive Experiences:
Interactive Assessments, Interactive Flipbooks & eBooks, Calculators, etc.
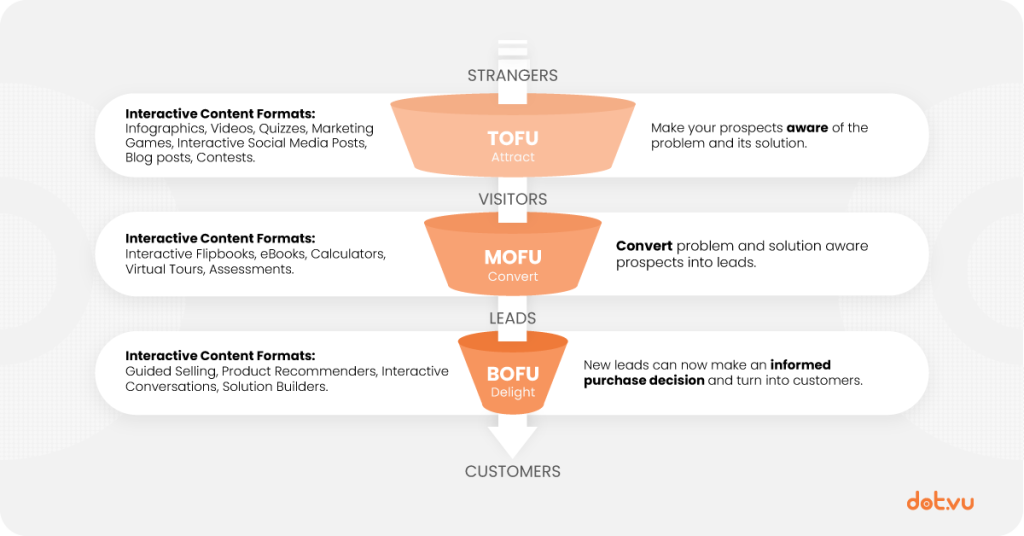
In the following images, you can learn about different Interactive Content formats depending on where in the buyer’s journey you need help.
3. Choose relevant KPIs
Once you have decided which Interactive Experiences you want to add to your Interactive Content strategy, you’ll want to choose which Interactive Content KPIs to follow closely. Interactive Content KPIs are Interactive Content metrics that you want to monitor. They are linked to your goals and should also follow the SMART process.
If we continue with our example, you could set up the following KPIs:
50 new leads from [Interactive Assessment] in the 2nd quarter of 2022.
100 new leads from [Interactive Flipbook 1] in the 2nd quarter of 2022.
200 new leads from [Interactive Flipbook 2] in the 2nd quarter of 2022.
Again, try to only follow the KPIs that are linked to your Interactive Content goals. That way, you are focused, and you don’t divide your attention between too many Interactive Content metrics.
4. Monitor KPIs
The next step in setting up your Interactive Content analytics is to set up tracking. In other words, you want to be able to track the success of your Interactive Experiences in real-time. This means that you can easily have an overview of all the important KPIs you are following, and how it is going in reaching your Interactive Content goals.
This way, if you see that you are having problems with one or more important Interactive Content KPIs, you can react straight away and modify your Interactive Experiences to improve the situation.
For example,
You notice midway through the 2nd quarter that you only got 10 new leads from your Interactive Assessment. You decide to promote your Interactive Assessment on Social Media to get more leads out of it.
5. Evaluate, Reflect & Optimize
At the end of the period you have established when setting up your goals, you should reflect on them. Did you reach them? What Interactive Experiences helped you the most to reach them? What worked well? Which Interactive Experiences should you improve? Was your Interactive Content promotion strategy on point?
At the end of the 2nd quarter, you are happy! You succeeded in reaching your goal. But you notice that your Interactive Flipbook #1 ranked way higher than your Interactive Flipbook #2. So, you decide to look at other Interactive Content metrics to learn more about why Interactive Flipbook #2 didn’t work so well.
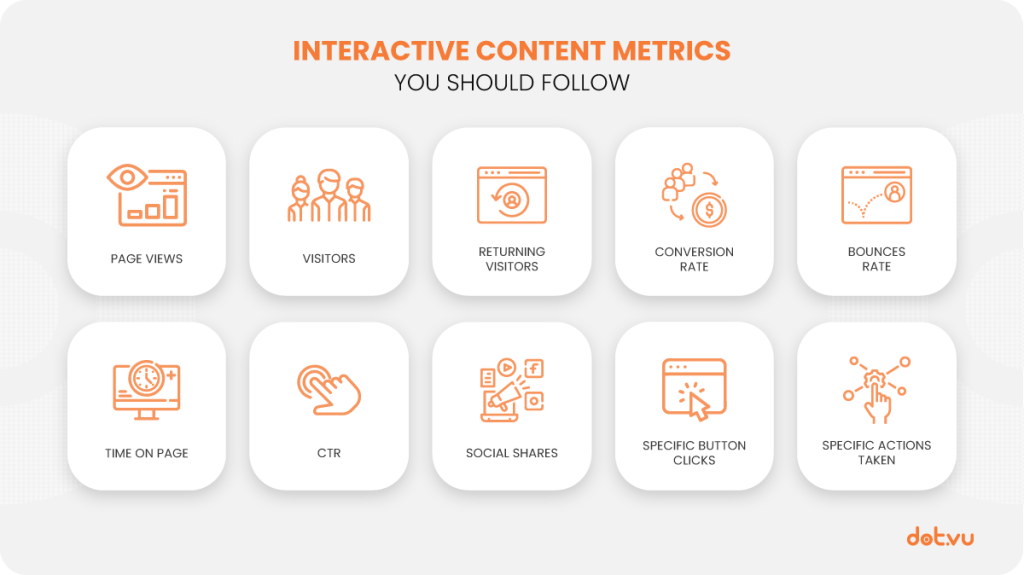
Interactive Content metrics you should follow
While setting overall Interactive Content goals and Interactive Content KPIs is extremely important, you also want to make sure that each Interactive Experience is optimized. In the following section, we will review 10 important Interactive Content metrics you can monitor for each Interactive Experience. While you won’t monitor these metrics as closely as your KPIs, they can be very useful to learn more about what’s going on.
1. Page Views
Page Views is the amount of time your Interactive Experience has been viewed. It is the sum of Visitors and Returning Visitors. You always want to make sure your Interactive Experiences are being viewed by the right audience. Therefore, if you look at this Interactive Content metric and you think your Interactive Experience has not been viewed enough, you should reflect on your promotion strategy. How can your audience find out about your Interactive Experience?
Another interesting idea would be to investigate where your views are coming from the most! Facebook? LinkedIn? Email Links? Google? Then, you can find out where you need to put more focus on and where you need to improve!
2. Visitors
This is the number of unique viewers that visited your Interactive Experience. It’s also interesting to consider because that’s one of the best measures to include as a KPI if your goal is generating awareness.
3. Returning Visitors
This is the number of visitors who have already tried your Interactive Experiences more than once before. This is a very important Interactive Content metric to monitor if you have Interactive Experiences where you want daily visits such as Interactive Advent Calendars, Hourly Surprises, etc. It is also often used to track engagement, loyalty, and the overall success of your Interactive Experiences.
4. Conversion Rate
The conversion rate is either based on leads or actual customers. Most often, for B2B companies with a long purchase journey, it’s based on leads. While for B2C and more precisely eCommerce companies it’s based on customers/purchases. So, for example, if you have an Interactive Assessment with a lead form, it will be based on leads. But if you have a Product Recommender, it would definitely be based on purchases. The conversion rate is calculated like this:
Conversion Rate = Total Conversions / Total Visitors * 100
The conversion rate measures the effectiveness of your Interactive Experiences. Do your Interactive Experiences lead to results?
5. Bounces Rate
The Bounce Rate is also a very important Interactive Content metric to consider. It is the number of visitors that leave an Interactive Experience without taking any action. An action could be clicking on a link, participating in your Quiz, filling out a form, and so on. The Bounce Rate can be used to verify the User-Experience of your Interactive Experiences and the overall design and copy.
If you have a very high Bounce Rate, you might consider changing the CTA of your Interactive Experience. For example, if your CTA was “Participate in this game now”, you could change it to “Participate and Win Prizes”. The idea of having the chance to win prizes could incentivize participation.
6. Time on page
Time on Page is exactly what you think, the time a visitor spends on your Interactive Experiences. It is an incredible Interactive Content metric to measure engagement. Because, the more engaging your Interactive Experiences are, the more visitors will spend time on them.
7. Click-Through Rate (CTR)
The CTR is the number of clicks the link to your Interactive Experiences got compared to how many times it was shown. It can be different depending on the channel. For example, on Facebook, the CTR is the number of clicks compared to the number of impressions. If you advertise your Interactive Experiences on Google Ads, the CTR would be the number of clicks compared to the number of times your ad was shown.
The CTR is an important metric if your goal is to generate awareness for your Interactive Experiences. It is also important to verify the effectiveness of your promotion tactics.
8. Social Shares
Social Shares are calculated by how many times a visitor shared your Interactive Experiences on their Social Media accounts. They are crucial when your goal is to generate Word-of-Mouth. They are also a must-follow when doing Social Interactive Content experiences.
9. Specific button clicks
You might also want to look within your Interactive Experiences to ensure that they are engaging and that users are interacting with them. One way to do so is by monitoring specific Button Clicks. For example, if you have a wheel-of-fortune within an Interactive Flipbook, you will want to know how many visitors tried the wheel-of-fortune. A way to do that would be to track the button “Spin the Wheel”. So, every time a visitor clicks on this specific button, it is added to the count.
10. Specific actions taken
Sometimes, you want to register specific actions rather than Button Clicks. For example, you’d like to know how many visitors watched more than 60 seconds of your Interactive Video, or how many visitors went to a specific room in your Interactive Virtual Tour. Again, this can be very interesting to measure the interactivity of your Interactive Experiences.
A/B Testing
Now that you know which Interactive Content metrics can help you track your Interactive Experiences, you can spot where you need to improve them by looking at the data. But how do you improve them? A great way would be to do A/B Testing. For example, if you get a High Bounce Rate, you can try changing your CTA to a new one and test it using A/B Testing. If you see that both CTA leads to similar results, maybe the CTA wasn’t the problem. Maybe, you could think about changing the overall design of your Interactive Experience and again test it using A/B testing.
In other words, you can use A/B testing to try different alternatives and see what works best. Keep in mind that Interactive Content is not static, hence you can always improve your design, copy, CTA’s, etc. That’s why using A/B testing is so relevant when designing Interactive Experiences.
Why using an Interactive Content platform the best way to measure the success of your Interactive Experiences?
Finally, if you want to monitor your Interactive Experiences the right way, you might want to think about using an Interactive Content platform. On Dot.vu, you can set up as many KPIs as you want, and you can connect the platform with your favorite CRM systems such as Hubspot, Marketo, and Salesforce to really optimize your overall Interactive Content Strategy.
If you want to get started but you have some questions, or you need help setting up your KPIs, don’t hesitate to contact us. Our Interactive Content experts are going to be happy to help you out!
Create a free account to get a feel of our platform, customize a template, and review your analytics options.